Ratings in the vehicle
Passengers using the SmartHail app (or branded equivalent) are invited to give ratings for the trip.
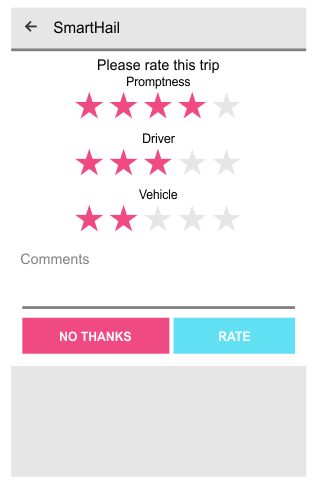
Any of the following aspects of the trip can be given a rating:
- Promptness. This allows the passenger to rate the arrival time. Note that late arrival might result in a low rating but this may be caused by high demand and not a fault by the driver.
- Driver. This is a rating of the driver. It could include the driver’s demeanor and/or presentation.
- Vehicle. This is a rating of the vehicle.
In addition a comment can be entered. There is no requirement that any of these fields be supplied.
If a job is cancelled (not by the app user) or No-showed, the user can enter a comment, but no star ratings.
Ratings on the website
The Ratings and Feedback page on the fleet management website is used to review the ratings received::
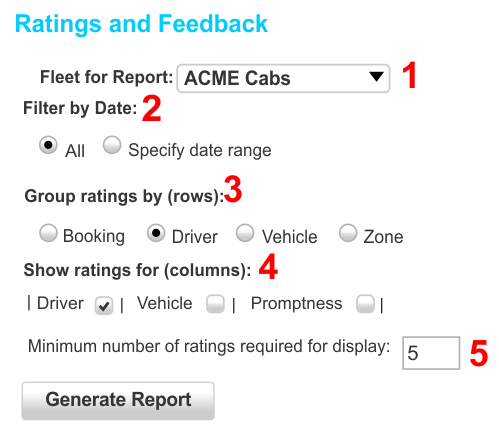
The fields on this page are:
- Fleet (1). Select the fleet required.
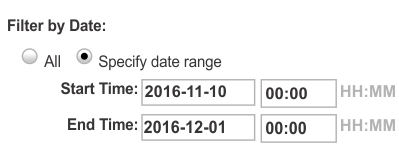
- Date (2). You can see all the available data or select a range.
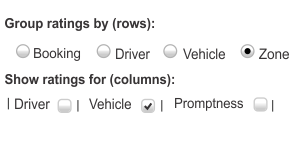
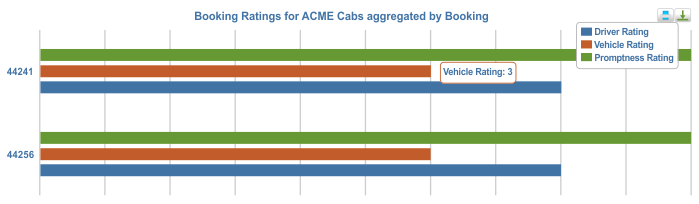
- Select how the data is to be grouped (3). This becomes the first column of the table.
- Select the data of interest (4). These are the columns in the report.
- The minimum number of ratings required before the data is included in the table (5). Generally it is considered unfair to make a critical assessment on the basis of just a few ratings.
The examples below show the various reports that can be produced.
Data selection
Before getting a report you need to indicate what data is to be produced.
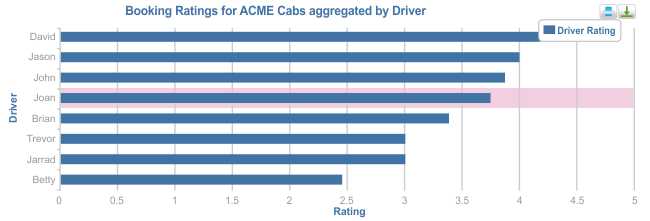
Will give the rating for each driver.
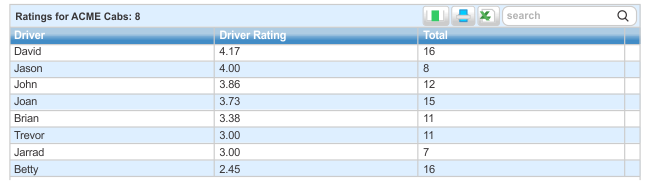
This shows, for example, that Betty has an average rating of 2.45 based on 16 ratings. If you click on a column heading the table will be sorted on that column.
The report is followed by a graph showing the same values in graphical form.
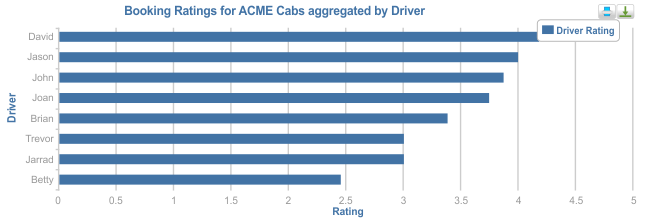
Clicking on a table row highlights the corresponding entry in the chart.
Booking reports
Selecting Booking gives a similar report but with the booking number in the first column.
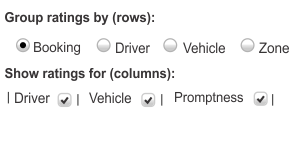
In this example all ratings checkboxes have been selected so all the available data is listed, including any comment made by the passenger. A “flyover” is used to display long messages. The time is the time when the rating was done, which may be some time after the job was completed.
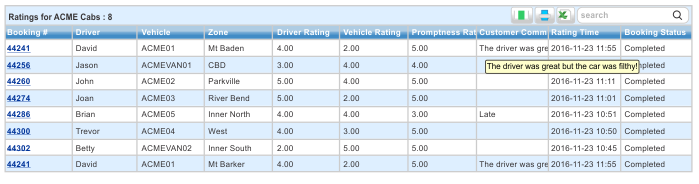
The graph shows each rating in a different colour. A flyover is used to display the value.
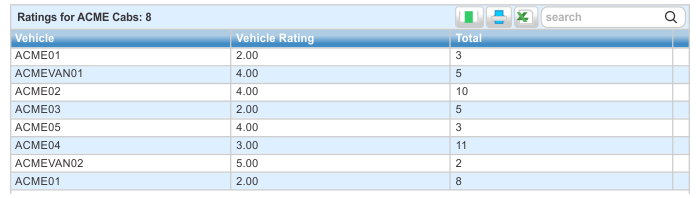
Vehicle report
The vehicle report can be used to summarise the ratings for the vehicle.
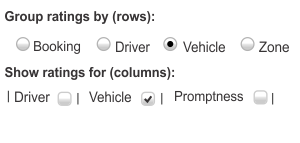
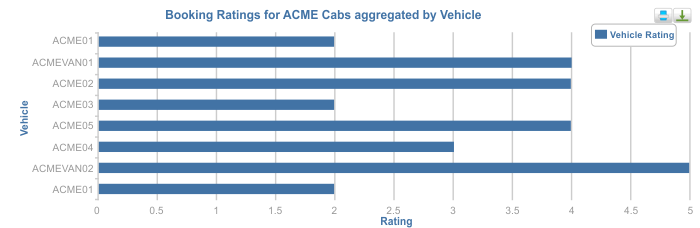
In this example the vehicle rating is being listed.
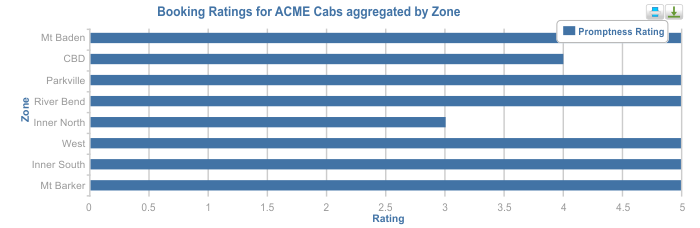
The information is also presented as a graph.
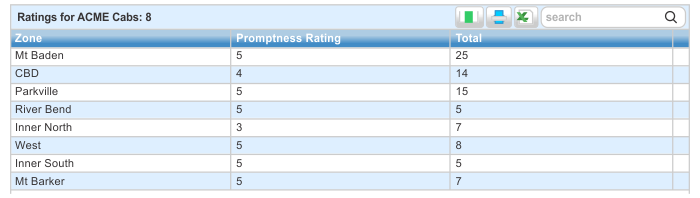
Zone report
The zone report can be used to summarise the ratings for each zone. In this context the zone is the pick-up zone.
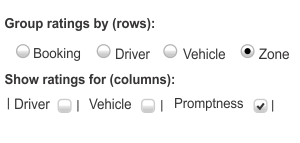
In this example promptness rating is listed by zone. This might be used to determine if there is a service problem in some zones.