Overview
The route map report produces a map showing the route taken by one or more vehicles over a given period of time. The report also shows the significant events that occurred in that period.
Information required
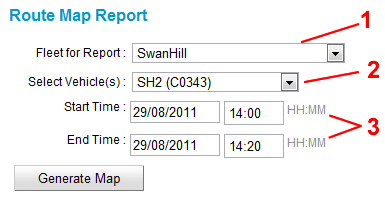
Select the fleet (1) and the vehicle(s) to be included in the report (2). Then enter the start and end date/time for the report (3).
Report
The lines on the map are coloured to show the state of the vehicle. Green means that the car was vacant; brown means that the car was booked, and blue indicates that the vehicle was engaged (job started).
The significant events that occurred can be shown below the map (6) or on the map (7) and is selected at the bottom (5).
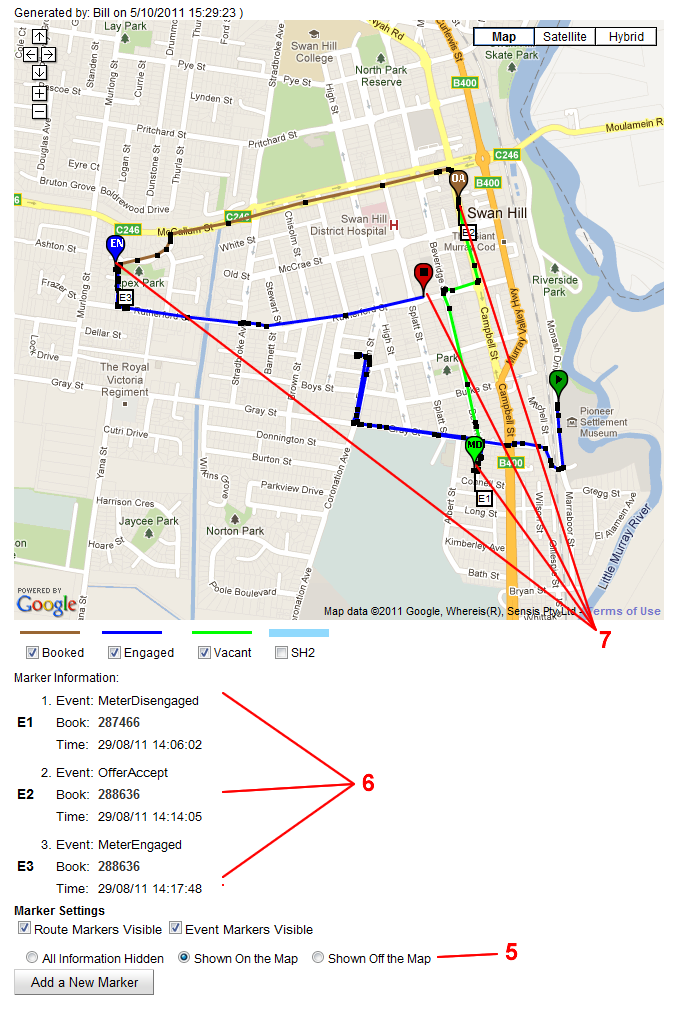
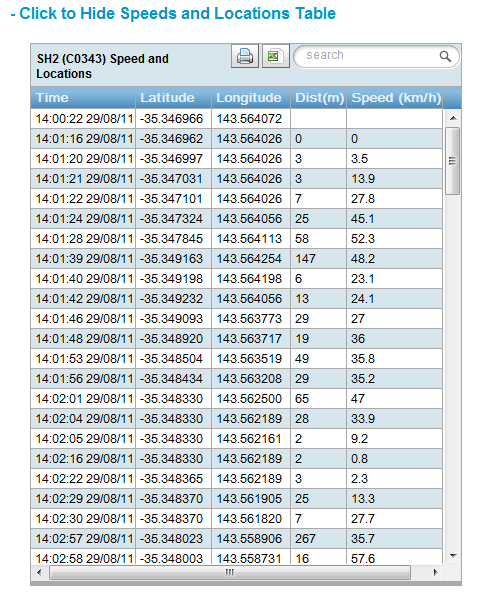
The individual data points that make up the line can be displayed by clicking on the text ‘Click to Show Speeds and Locations Table’ (4).
![]()
For example:
See also: Find Vehicle